On Saturday we took the grandchildren to Summerleaze Beach in Bude. You can read all about that excursion (and see moving surfing pictures!), here.
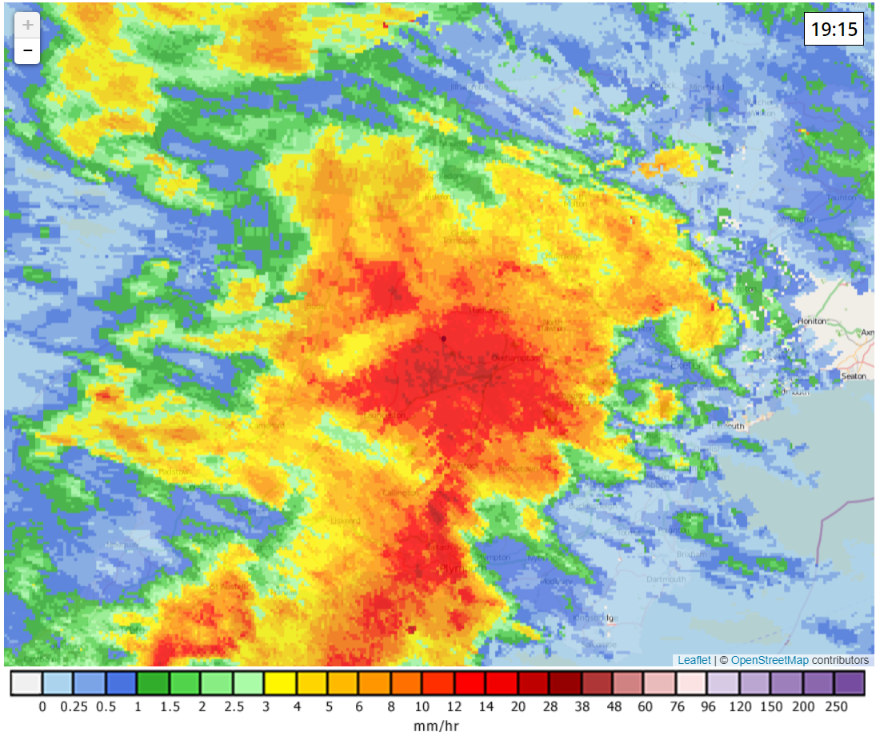
Yesterday the children went to Widemouth Sand instead, but later in the day the next band of heavy rain arrived. Here’s the Netweather.tv rain radar map for South West England yesterday evening:
The rainfall produced an unfortunate side effect. Here’s South West Water’s “Water Fit Live” sewage pollution map from (much!) earlier this morning:
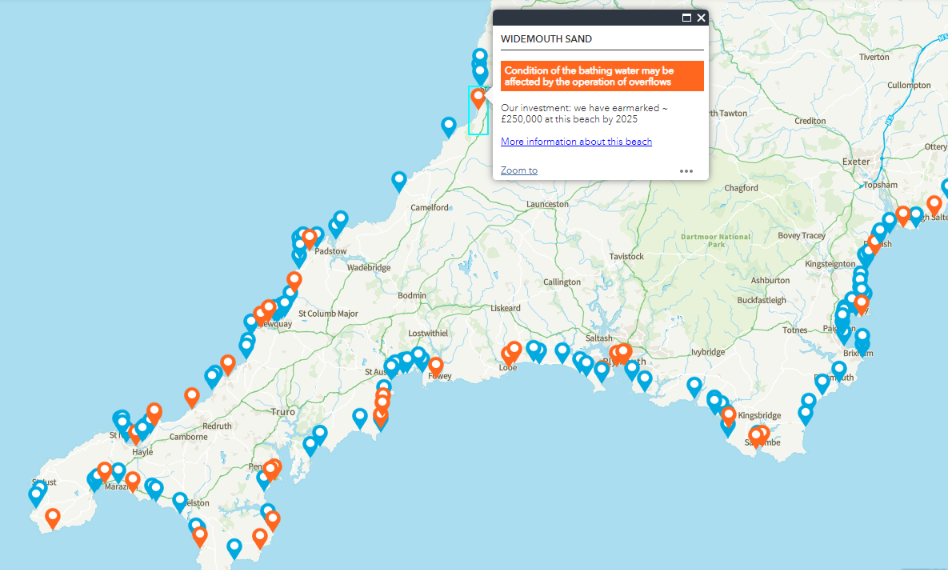
I’ve asked the South West Water “Help” team on Twitter when the alarm went off at the Combined Sewer Overflow monitor at Widemouth, but they haven’t got back to me yet.
[Edit – August 2nd 14:30]South West Water have informed me via Twitter that:
The rain has finally stopped, for the moment at least. Here’s how the Surfers Against Sewage pollution map looks at 8:30 this morning:

South West Water’s own Water Fit Live map looks very different:

That’s because South West Water state that they flag locations where the:
Monitor activated in the last 24 hours

whereas the SAS map instead indicates beaches where:
Storm sewage has been discharged from a sewer overflow in this location within the past 48 hours.
P.S. SWW inform me that the above “monitor activation” colours apply to the individual beach maps. The pushpins on the overview map shown above revert to blue after 12.5 hours.
To be continued…
South West Water have clarified the meaning of the coloured dots on the different Water Fit Live maps. My attention was directed to part of the Water Fit Live FAQ, near the bottom of this page: